


无胰岛素的 NeuroCult SM1
了解更多


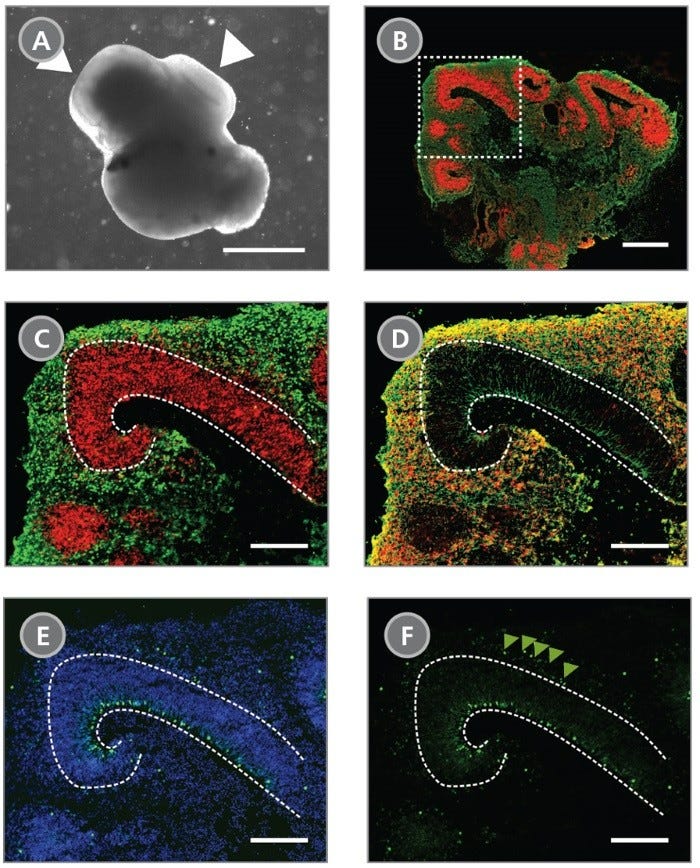
Figure 1. Cerebral Organoids Contain Multiple Layered Regions That Recapitulate the Cortical Lamination Process Observed During In Vivo Human Brain Development
(A) A representative phase-contrast image of a whole cerebral organoid at Day 40 generated using the STEMdiff™ Cerebral Organoid Kit. Cerebral organoids at this stage are made up of phase-dark structures that may be surrounded by regions of thinner, more translucent structures that display layering (arrowheads). (B) Immunohistological analysis on cryosections of cerebral organoids reveals cortical regions within the organoid labeled by the apical progenitor marker PAX6 (red) and neuronal marker β-tubulin III+ (TUJ-1) (green). (C-F) Inset of boxed region from (B). (C) PAX6+ apical progenitors (red, enclosed by dotted line) are localized to a ventricular zone-like region. β-tubulin III+ neurons (green) are adjacent to the ventricular zone. (D) CTIP2, a marker of the developing cortical plate, co-localizes with β-tubulin III+ neurons in a cortical plate-like region. Organization of the layers recapitulates early corticogenesis observed during human brain development. (E) Proliferating progenitor cells labeled by Ki-67 (green) localize along the ventricle, nuclei are counterstained with DAPI (blue). (F) An additional population of Ki-67+ cells is found in an outer subventricular zone-like region (arrowheads). Scale bar = (A) 1 mm, (B) 1 mm and (C-F) 200 µm.
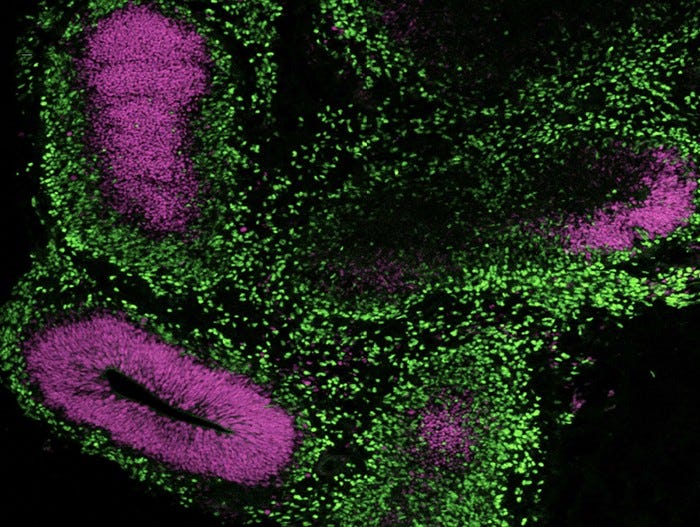
Figure 2. Cerebral Organoids Can Be Generated from hPSCs Maintained in mTeSR™ Plus
Human ES (H9) cells were cultured with mTeSR™ Plus and directed to cerebral organoids using the STEMdiff™ Cerebral Organoid Kit. Image shows apical progenitor marker SOX2 (magenta) and neuronal marker TBR1 (green).
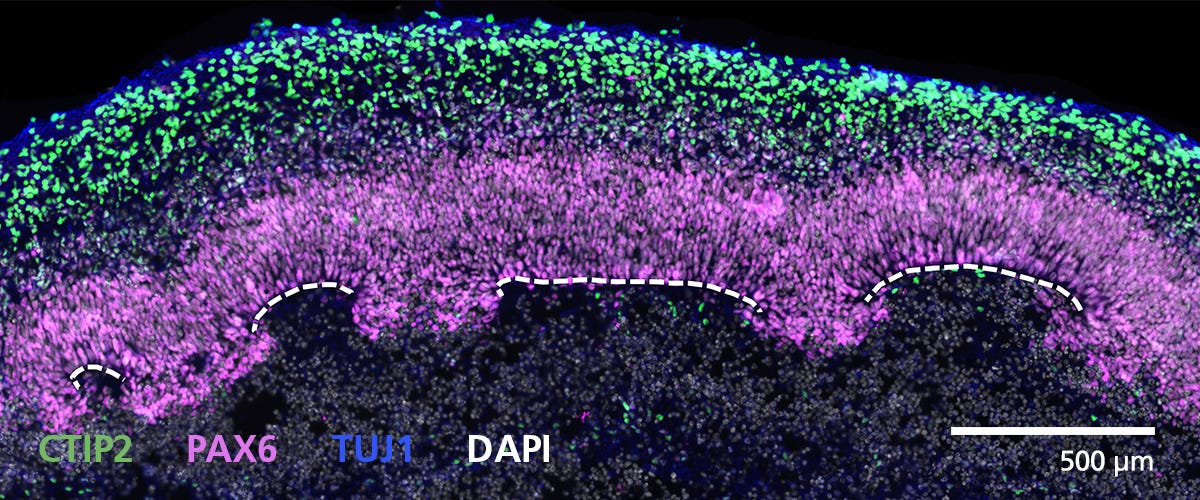
Figure 3. Cryosectioned Cerebral Organoids Show Stratification of Cortical Plate Neurons and Progenitor Zones
Cerebral organoids were generated using the STEMdiff™ Cerebral Organoid Kit. A 16-μm-thick section of a Day 40 cerebral organoid was stained for CTIP2 (green), PAX6 (magenta), βIII-tubulin/TUJ1 (blue), and DAPI (gray). Cortical regions are defined by progenitor cells (PAX6+) that are radially organized around a pseudo-ventricle (dashed line). These progenitors give rise to cortical plate neurons indicated by CTIP2 and TUJ1 expression. For a detailed cryogenic tissue processing and immunofluorescence protocol, please see the Methods Library.
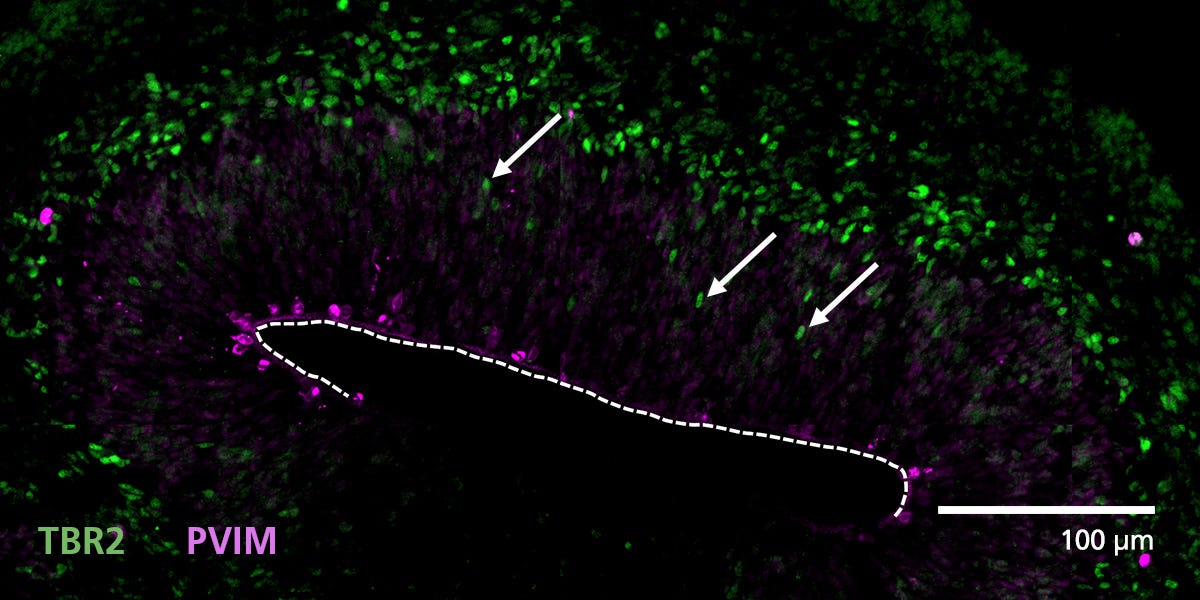
Figure 4. Zones of Active Proliferation in Cerebral Organoids Are Preserved Following the Protocol for Tissue Processing
Organoid tissue was processed for immunofluorescence and stained for TBR2 (intermediate precursors, green) and phosphorylated vimentin (PVIM, dividing cells, magenta). Cells actively divide at the apical border of cortical regions along the border of the pseudo-ventricle (dashed line). A population of these dividing cells will express TBR2 and then migrate (arrows) from the progenitor zone to form a layer of intermediate progenitors. For a detailed cryogenic tissue processing and immunofluorescence protocol, please see the Methods Library.
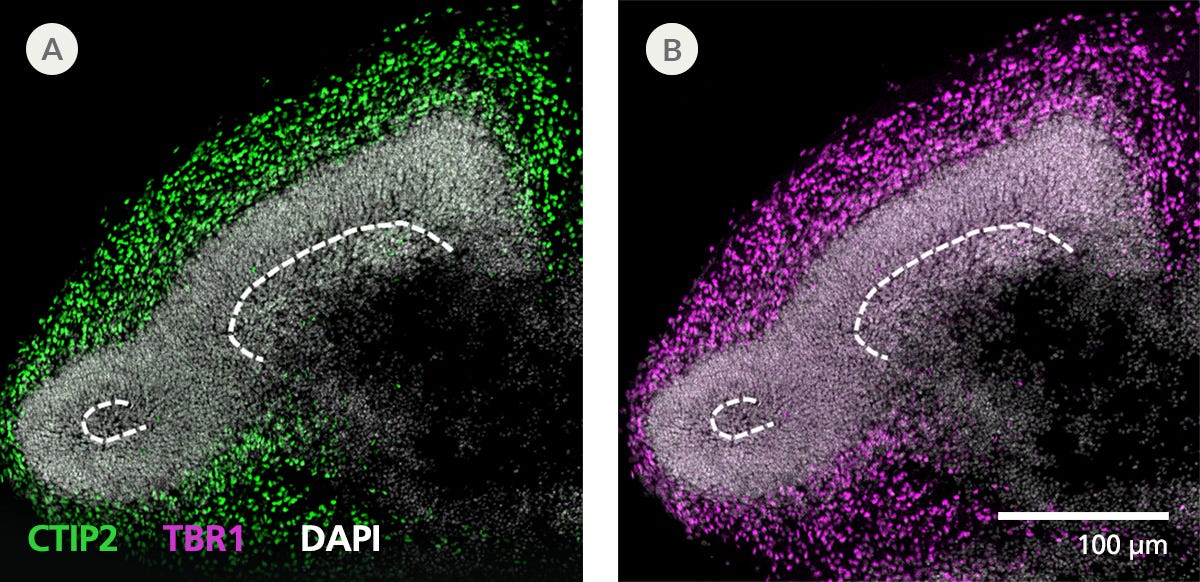
Figure 5. Immunofluorescence from Cryosectioned Cerebral Organoids Indicates Preserved Organization of Cortical Neurons
Organoid tissue was processed for immunofluorescence and stained for CTIP2 (green), TBR1 (layer 5/6 cortical neurons, magenta), and DAPI (white). Deep layer neuronal markers CTIP2 and TBR1 are expressed in cells around presumptive progenitor zones (dashed line) toward the outside or apical surface of organoids. For a detailed cryogenic tissue processing and immunofluorescence protocol, please see the Methods Library.
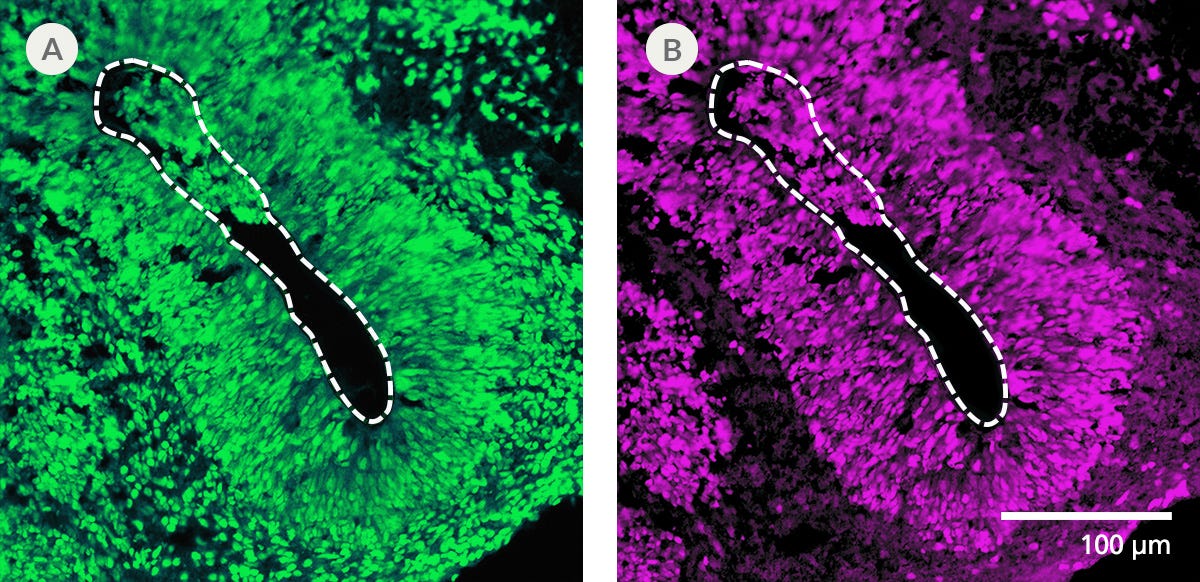
Figure 6. Cryogenic Tissue Processing and Immunofluorescence Captures Arrangement of Neural Progenitors Around Pseudo-Ventricles in Cerebral Organoids
Organoid tissue was processed for immunofluorescence and stained for (A) FOXG1 (forebrain cells, green) or (B) SOX2 (neural progenitors, magenta). Organoids derived from STEMdiff™ Cerebral Organoid Kit generate forebrain-type tissue as indicated by FOXG1 expression. Neural progenitors expressing SOX2 are radially arranged around a pseudo-ventricle area (dashed line). For a detailed cryogenic tissue processing and immunofluorescence protocol, please see the Methods Library.
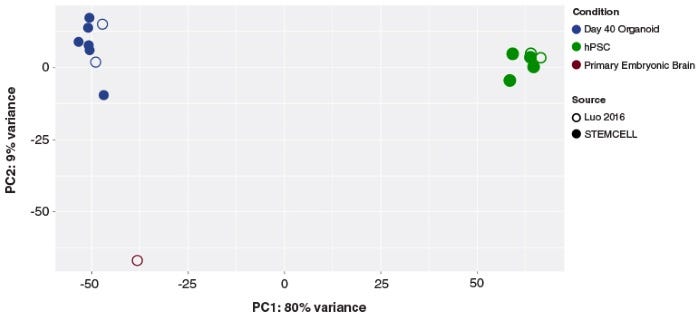
Figure 7. Cerebral Organoids Generated with the STEMdiff™ Cerebral Organoid Kit Are Transcriptionally Similar to Those from Published Protocols
Principal component analysis of hPSC and cerebral organoid transcriptomes. Cerebral organoids generated using the STEMdiff™ Cerebral Organoid Kit (filled blue circles) cluster together, and cluster with previously published (C Luo et al. Cell Rep, 2016) cerebral organoids (open blue circles). The first principal component accounts for the majority of variance seen (PC1; 80%) and distinguishes the cerebral organoid samples from the hPSCs (green circles). The second principal component accounts for only 9% of the variation, and highlights the modest expression differences between cultured organoids and primary embryonic fetal brain samples (19 post-conceptional weeks, brown circles).
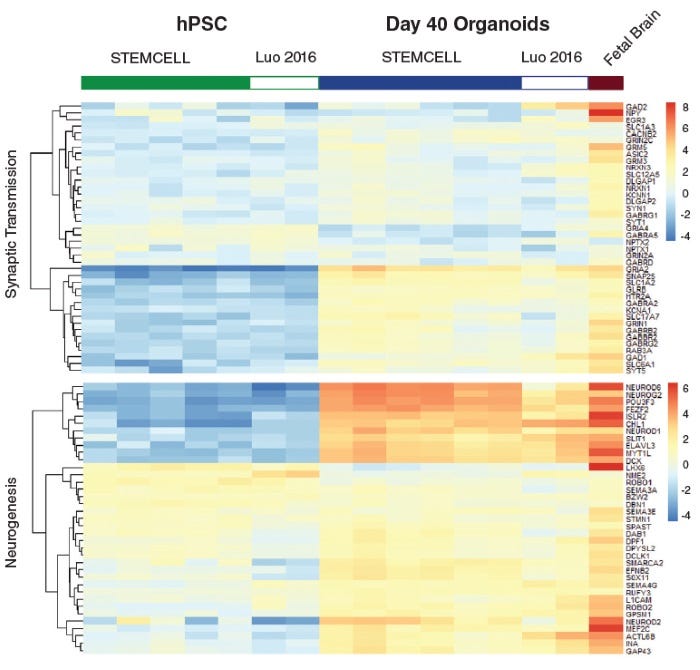
Figure 8. Neural Organoids Generated with STEMdiff™ Cerebral Organoid Kit Express Expected Key Markers
Heatmap of expression levels for genes associated with synaptic transmission function and neurogenesis in Day 40 organoids. These data show that gene expression of cerebral organoids generated from the STEMdiff™ Cerebral Organoid Kit are similar to published results (C Luo et al. Cell Rep, 2016).

Figure 9. Neural Organoids Generated with STEMdiff™ Cerebral Organoid Kit Contain Diverse Cell Types
Unguided cerebral organoids were generated from H9 ESCs using STEMdiff™ Cerebral Organoid Kit. scRNA-seq gene expression data captures the cellular diversity of these neural organoids which can be further explored using the Single Cell RNA Sequencing Data Visualization Tool for Neural Organoids . At Day 50, the organoids were dissociated into a single-cell suspension. The library was prepared using Chromium Single Cell 3ʹ v1 protocol with Feature Barcoding technology (10x Genomics) following surface protein staining with TotalSeq™–B (BioLegend). The barcoded processing, gene counting, and aggregation were done using the Cell Ranger software v3.1.0. Further processing and demultiplexing was done with Seurat v4.1.1. The data have been made publicly available on GEO: GSE218457. ESC = embryonic stem cell

Figure 10. STEMdiff™ Cerebral Organoids Exhibit Synchronous Calcium Activity
Cerebral organoids were generated using the STEMdiff™ Cerebral Organoid Kit and matured with the STEMdiff™ Cerebral Organoid Maturation Kit. On Day 91, organoids were imaged using the ImageXpress® Confocal HT.ai High-Content Imaging System (Molecular Devices) with MetaXpress® High-Content Image Acquisition and Analysis Software. (A) Time-lapse images of a representative region within a cerebral organoid. Arrows indicate areas of elevated calcium signal intensity. (B) Corresponding heatmap representation of calcium intensity from the regions shown in (A) over time. Signal propagation from the initial peak to surrounding areas suggests the presence of a functional neuronal network.
请在《产品说明书》中查找相关支持信息和使用说明,或浏览下方更多实验方案。
| 文档类型 | 产品名称 | 目录编号# | 批次号# | 语言 |
 产品信息表
产品信息表 |
STEMdiff™ Cerebral Organoid Kit | 08570 | All | English |
|
安全数据表 |
STEMdiff™ Cerebral Organoid Kit | 08570 | All | English |
|
安全数据表 |
STEMdiff™ Cerebral Organoid Kit | 08570 | All | English |
|
安全数据表 |
STEMdiff™ Cerebral Organoid Kit | 08570 | All | English |
|
安全数据表 |
STEMdiff™ Cerebral Organoid Kit | 08570 | All | English |
|
安全数据表 |
STEMdiff™ Cerebral Organoid Kit | 08570 | All | English |
|
安全数据表 |
STEMdiff™ Cerebral Organoid Kit | 08570 | All | English |
|
安全数据表 |
STEMdiff™ Cerebral Organoid Kit | 08570 | All | English |
Related Products


